
What is a Bar Chart?
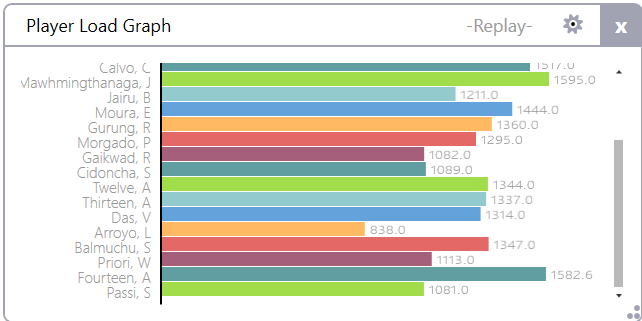
A Bar Chart is a Console Widget in which the numerical data per Athlete for a Parameter is visually represented by the length of a rectangle. A Bar Chart can be created for any OpenField Parameter.
It is recommended that only 1 to 3 parameters are selected for a single Bar Chart. A Bar Chart can be used to display data for selected Athletes for a specific Period or for the whole Activity.
How to Create a Bar Chart
- Open an existing or new Activity in the OpenField Console.
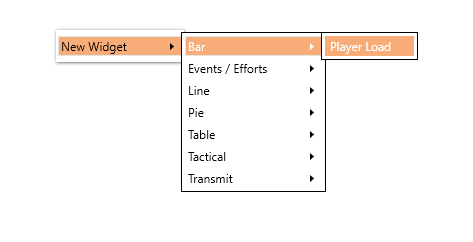
- In any Dashboard, right click on any white space on the Dashboard.
- Select New Widget.
- Select Bar.
- Select Player Load.
How to Customise a Bar Chart
- From the Bar Chart widget, select the Settings icon in the top right corner of the widget.
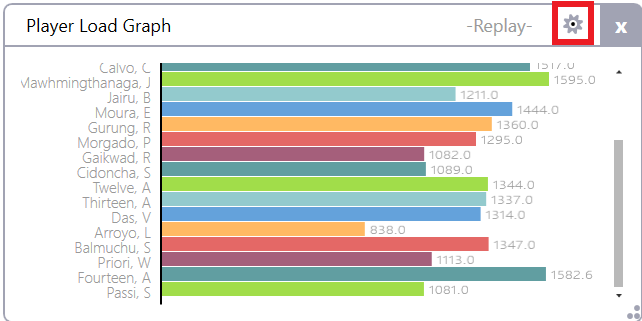
- From the Settings menu you have the option to select the Basics, Parameters or Options tabs.
Basics Tab
- Change the name of the Bar Graph.
- Change the Widget from Live to Replay.
- Export the Widget as a .png file to the following pathway: C:\Users\Documents\Catapult Sports\OpenField\Logs\*Date of Activity*
- Sort data by current group, home team, away team or by distance > 0
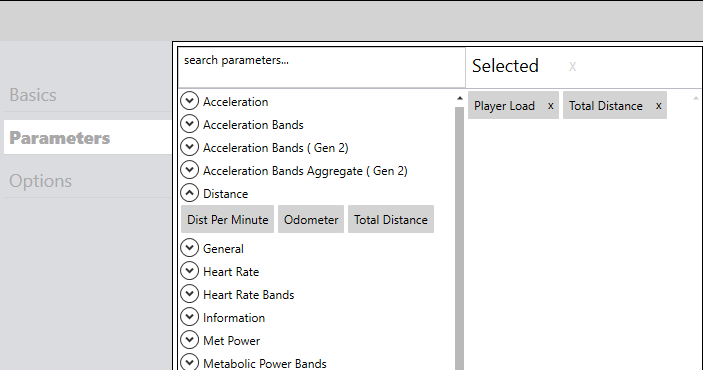
Parameters Tab
- Change the parameter that is displayed in the Bar Chart. Note: The parameter is automatically populated as Player Load, but you may delete this and select any parameters you wish to graph. Selected parameters will be displayed in the ‘Selected’ column on the right. To delete a selected parameter, select the x to the right of the parameters name in the Selected column. It's recommended that you only select 1-3 parameters.
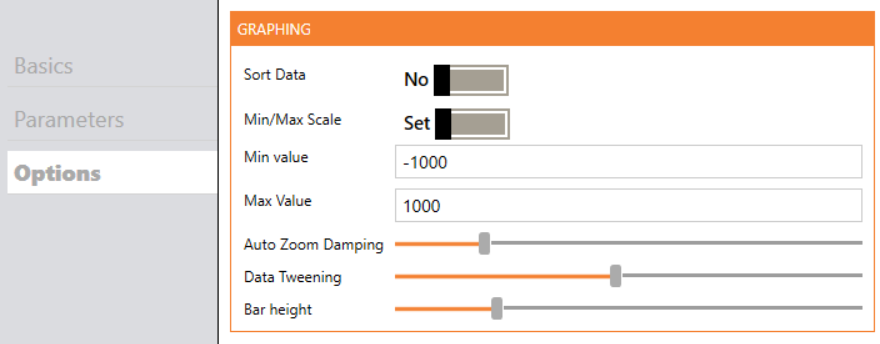
Options Tab
- Toggle the Sort Data slider to choose whether or not to automatically sort the data in real time.
- Toggle the Min/Max Scale to adjust the scale of the chart Y axis.
- Adjust the display of the chart through auto zoom damping, data tweening and bar height of the box chart.
Related articles